
Purpose of this paper. This paper examines the cost of restricted cash: collections that have been received into a controlled account and cannot be used by anyone until the next payment date. It sets out where that balance comes from, what it costs each year, how much of it a daily borrowing base and a daily waterfall recover, and why recovering it leaves the lender in the same position on the payment date. It is the economic counterpart to the two Granite Pass papers that precede it, and it depends on the operational discipline they describe.
Executive summary
Structured finance collects continuously and settles periodically. Obligors pay on every business day of the month; the waterfall runs once. In the interval between those two frequencies sits a balance of cash that has been collected, deposited and evidenced, and that no one can use.
Three terms are used precisely in this paper and are not interchangeable. Restricted cash is the balance itself: collected amounts held in a controlled account pending application. Trapped cash is the characterization: the portion of that balance held for no reason other than settlement cadence. Negative carry is the cost: the difference between what the balance is financed at and the nothing it earns.
On the illustrative $1 billion portfolio modeled here, restricted cash averages between 1.65 and 4.26 percent of securitization value, depending on when the payment date falls and how often the waterfall runs. At the common configuration of a monthly waterfall and a payment date on the 25th, the balance averages 3.41 percent of securitization value, or $34.1 million. Financed at a 2.00 percent facility coupon on the advanced portion and an 11.00 percent cost of capital on the sponsor’s portion, it costs approximately $1.0 million a year. That cost recurs every year, for the life of the facility, and buys nothing.
Core claim. Trapped cash is a calendar outcome, not a credit outcome. The assets that produced the balance were already counted in the borrowing base before the cash arrived. Holding the proceeds until the payment date adds no coverage. It converts earning collateral into idle collateral and charges the sponsor for the conversion.
Two variables change the number, and they are not the same in kind. Moving the payment date closer to the end of the collection period shortens the window in which cash is trapped, and for an amortizing pool it is the larger effect: roughly half the balance. Running the waterfall daily contributes a further 3 to 9 percent. Only the second lever can take the balance to zero, and in a master trust in its revolving period a daily principal waterfall does exactly that. There is no residual.
None of this is available to a transaction that cannot see its own collections daily. A daily waterfall requires a daily borrowing base, and a daily borrowing base requires verified, asset-level collection data on the day the money arrives. The control capability described in the two companion papers and the capital efficiency described in this one are the same capability viewed from two sides.
Why cash gets trapped
A monthly structure defines a collection period, usually a calendar month, and a payment date some days after that period closes. The gap exists for a practical reason. The servicer needs time to close its books, the administrator needs time to prepare the report, and the trustee needs time to review it before money moves. The gap is a reporting artifact. It was never a credit feature.
Consider a dollar collected under a calendar-month collection period with a payment date on the 25th of the following month. A dollar collected on the first day of the period waits about fifty-five days before it is applied. A dollar collected on the last day waits twenty-five. The average dollar waits roughly forty days. Move the payment date to the 5th and the same three figures become thirty-five, five and roughly twenty. Nothing about the assets has changed. Only the calendar has.
The collection pattern matters as well. A pool whose obligors pay early in the month accumulates its balance sooner and therefore holds it longer, which is why the front-loaded scenarios in this paper carry higher average balances than the even ones. The effect is mechanical: it reflects payment timing, not credit quality.
What makes the balance a cost rather than a neutrality is that it is financed twice over. The advanced portion, 90 percent under the assumptions used here, accrues the facility coupon whether the proceeds sit in a controlled account or in an earning asset. The remaining 10 percent is the sponsor’s own capital, committed and unavailable. The balance itself earns nothing.
The two levers
Lever A. Waterfall cadence
The first lever is how often the waterfall runs. A monthly principal waterfall applies a full period of collections on one day. A daily principal waterfall tests the borrowing base each day, retains the amount required to meet the upcoming payment date obligation, and releases the remainder as it arrives. In a revolving structure the released principal funds new receivable purchases the same day, which is why the balance goes to zero rather than merely falling.
The operational requirement is real. A daily waterfall in an amortization period is a reserve and release calculation performed every day: what the next payment date requires in principal due, interest, fees and required reserves, and what is held against that requirement today. The answer is arithmetic rather than judgment, but it is arithmetic that cannot be performed on a servicing tape arriving three weeks after the period closes.
Lever B. Payment date timing
The second lever is where the payment date falls. Moving it from the 25th to the 5th of the following month removes twenty days from the front of every dollar’s waiting period. On the model used here it cuts the average trapped balance roughly in half, which is a larger effect than cadence for an amortizing pool.
The prerequisite for an earlier payment date. A sponsor cannot move a payment date from the 25th to the 5th if the servicing data takes three weeks to arrive and reconcile. The earlier date is only available to a transaction that can close, reconcile and report a collection period within days of its end. Near real-time, verified, asset-level data is what makes the calendar negotiable in the first place.
The levers are independent. A transaction can move its payment date without changing its waterfall cadence, and can run a daily waterfall without moving its payment date. They also differ in kind: moving the payment date shortens the window in which cash is trapped, while only daily settlement eliminates it.
What the model shows
The analysis below is an illustrative model of a $1 billion securitization with the following assumptions. The figures are used to show relative magnitudes and are not drawn from any specific transaction.
| ASSUMPTION | VALUE |
| Monthly principal collections | $26,000,000 |
| Monthly principal collections, % of securitization value | 2.60% |
| Implied securitization value | $1,000,000,000 |
| Advance rate | 90.00% |
| Securitization weighted average coupon | 2.00% |
| Corporate weighted average cost of capital | 11.00% |
TABLE 1 Model assumptions. Illustrative figures used throughout this paper.
The daily balance profile is a sawtooth. Collections accumulate through the collection period and through the reporting gap that follows it, and the balance falls sharply on the payment date when the prior period’s principal is applied. Under a monthly waterfall with a payment date on the 25th the balance never approaches zero: at the moment of release it still holds twenty-five days of the current period’s collections, which are not due until the following month. The daily waterfall line sits slightly below the monthly line throughout, because the excess over the next payment date requirement is released as it arrives. The revolving master trust line is flat at zero, and the shaded band between the average lines is the recoverable opportunity.
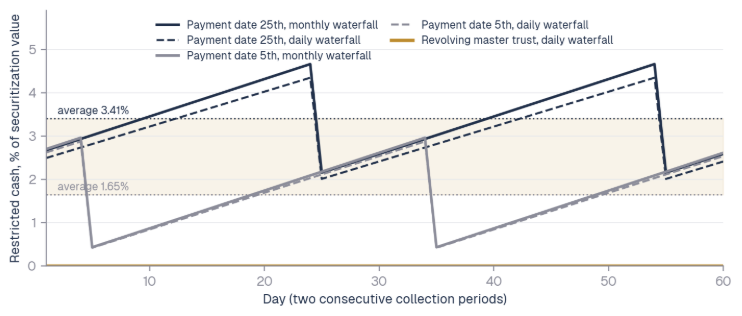
FIGURE 1 Daily restricted cash balance across two consecutive collection periods, even collections. Averages shown for the 25th monthly case and the 5th daily case.
Across the four cadence and payment date combinations, and both collection patterns, the average daily balance is as follows.
| SCENARIO | EVEN, MONTHLY | EVEN, DAILY | VAR. | FRONT-LOADED, MONTHLY | FRONT-LOADED, DAILY | VAR. |
| Payment date, 25th | 3.41% | 3.18% | −6.62% | 4.26% | 3.87% | −9.10% |
| Payment date, 5th | 1.70% | 1.65% | −3.25% | 2.56% | 2.34% | −8.50% |
| Combined, 25th monthly to 5th daily | 3.41% | 1.65% | −51.6% | 4.26% | 2.34% | −45.1% |
TABLE 2 Average daily restricted cash as a percentage of securitization value. The combined row compares the 25th monthly baseline with the 5th daily case.
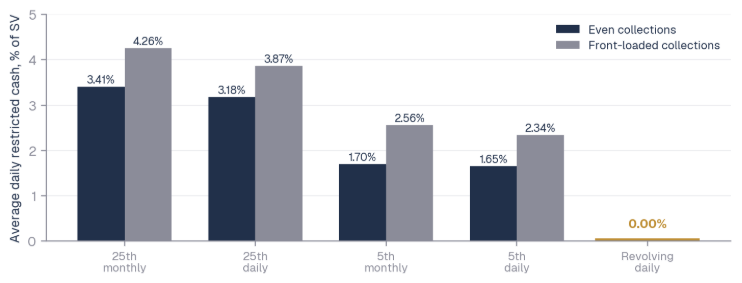
FIGURE 2 Average daily restricted cash by scenario. The revolving master trust under a daily principal waterfall is the gold column at zero.
The honest reading of these numbers. For an amortizing pool the payment date is the bigger lever, removing roughly half the trapped balance on its own. Moving from a monthly to a daily waterfall adds a further 3 to 9 percent. A paper claiming that daily waterfalls alone solve this problem would not survive contact with anyone who has modeled it. What daily settlement does that the calendar cannot is remove the residual entirely, and that result belongs to the revolving case.
The operational split is worth stating plainly, because the two periods behave differently.
1. Revolving period. A daily principal waterfall results in a zero restricted cash balance. There is nothing to reserve. Collections release into new receivable purchases as they arrive, and the working capital drag disappears rather than shrinking.
2. Amortization period. Daily release requires the mechanical reserve and release calculation described above: hold what the next payment date needs, release the rest. The benefit is real but bounded, and it is entirely dependent on daily, asset-level data.
The cost of the trapped balance
The balance itself is not the cost. The cost is what it takes to finance it. Each scenario carries two components: negative carry on the advanced portion at the facility coupon, and opportunity cost on the sponsor’s portion at its cost of capital. Both scale proportionally with the balance, so reducing the balance reduces the cost in a straight line.
| EVEN, 25TH, MONTHLY | EVEN, 5TH, DAILY | FRONT-LOADED, 25TH, MONTHLY | FRONT-LOADED, 5TH, DAILY | |
| Average restricted cash, % of SV | 3.41% | 1.65% | 4.26% | 2.34% |
| Average restricted cash | $34.1M | $16.5M | $42.6M | $23.4M |
| Advanced portion, at 90% | $30.7M | $14.9M | $38.3M | $21.1M |
| Negative carry, at 2.00% coupon | $0.61M | $0.30M | $0.77M | $0.42M |
| Sponsor portion, at 10% | $3.4M | $1.7M | $4.3M | $2.3M |
| Opportunity cost, at 11.00% WACC | $0.38M | $0.18M | $0.47M | $0.26M |
| Total annual run-rate cost | $0.99M | $0.48M | $1.24M | $0.68M |
| Total run-rate cost, % of SV | 0.10% | 0.05% | 0.12% | 0.07% |
TABLE 3 Annual carrying cost of the trapped balance. Figures recur every year for the life of the facility.
Roughly $1.0 million a year on $1 billion, falling to roughly $0.5 million, invites the response that a tenth of a percent is not worth the operational effort. That misreads the figure. It is not a one-time expense but an annual run rate that recurs for the life of the facility, scales across every transaction a sponsor has outstanding, and is incurred in exchange for nothing. The clearer way to see the same number is on the advance rate.
Maximum effective advance rate
The nominal advance rate stated in a facility is applied to total securitization value. What a borrower experiences is the leverage it achieves against earning assets, because the portion of the pool sitting as restricted cash produces no return while still requiring equity behind it. We call the second figure the maximum effective advance rate: the advance rate the borrower realizes against earning assets, as opposed to the nominal advance rate applied to total securitization value.
The derivation is simple arithmetic on the base assumptions. Securitization value is $1,000 million and the nominal advance rate is 90 percent, so debt is $900 million and sponsor equity is $100 million. At the 25th and monthly baseline with even collections, average restricted cash is 3.41 percent of securitization value, or $34.1 million. Earning assets therefore average $965.9 million rather than $1,000 million. Equity required per dollar of earning assets is $100 million divided by $965.9 million, or 10.35 percent, which is an effective advance rate of 89.65 percent.
| 25TH, MONTHLY | 5TH, DAILY | REVOLVING, DAILY | |
| Securitization value | $1,000.0M | $1,000.0M | $1,000.0M |
| Nominal advance rate | 90.00% | 90.00% | 90.00% |
| Debt | $900.0M | $900.0M | $900.0M |
| Sponsor equity | $100.0M | $100.0M | $100.0M |
| Average restricted cash | $34.1M | $16.5M | $0.0M |
| Earning assets | $965.9M | $983.5M | $1,000.0M |
| Equity per dollar of earning assets | 10.35% | 10.17% | 10.00% |
| Maximum effective advance rate | 89.65% | 89.83% | 90.00% |
| Advance rate lost to settlement cadence | 35 bps | 17 bps | 0 bps |
TABLE 4 Derivation of the maximum effective advance rate, even collections.
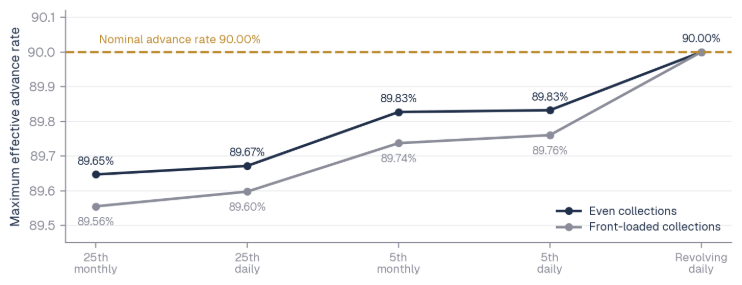
FIGURE 3 Maximum effective advance rate by scenario, converging on the nominal 90.00 percent ceiling as trapped cash approaches zero.
The framing that matters. The nominal advance rate is a ceiling the borrower never actually touches. Settlement cadence, not credit, is what holds it below. Roughly 35 basis points of advance rate is lost to timing alone, which is equivalent to requiring about 3.5 percent more equity to carry the same earning asset base. On a levered return that is not a rounding error, and unlike most sources of advance rate improvement, it costs the lender nothing to give back.
One convention has to be named rather than assumed. This derivation treats collection account cash as receiving no borrowing base credit. Facilities that advance against controlled account balances at or near par will show a smaller effect; facilities that exclude those balances entirely will show the full effect. Any sponsor running this analysis on its own facility should establish which convention its documents apply, because the answer changes the size of the prize.
Why this does not weaken lender protection
This is the objection that matters, and it deserves a direct answer rather than a reassurance. The concern is that cash held in a controlled account is protection, and that releasing it daily gives away collateral coverage in exchange for borrower convenience.
It does not, for a specific reason. A daily waterfall run against a daily borrowing base retains the full amount required to meet the upcoming payment date obligation: principal due, interest due, fees and any required reserves. Only the remainder is released. On the payment date the lender’s position is identical to what it would have been under monthly settlement, because the amount available on that date is the same. What changed is the treatment of the excess in the intervening days, and the excess was never part of the payment date requirement.
Trapped cash is not collateral coverage. It is idle collateral coverage that has already been counted. The receivable that generated the cash was in the borrowing base before the obligor paid. When the payment arrives, the asset is removed and the cash takes its place, so nothing has been added to the lender’s position. Continuing to hold the proceeds counts the same value twice, once as coverage and once as cost.
The lender also gets something in exchange. A borrowing base tested daily produces more frequent visibility, not less. Under monthly settlement, a deterioration that begins on the third of the month reaches the lender when the report arrives, which may be six weeks later. Under daily settlement it is visible the next morning, and the release mechanic stops when the borrowing base no longer supports it. Releases that suspend automatically on a daily test are stronger protection than a balance that accumulates passively regardless of what the pool is doing.
What daily settlement does not do
The same discipline applied in the companion papers applies here. A benefit worth claiming is worth bounding.
— It does not improve credit quality. A daily waterfall changes when cash moves. It does not change whether an obligor pays, and no amount of settlement efficiency compensates for a pool that is underperforming.
— It does not help a facility whose documents fix the settlement mechanics. Payment dates, waterfall frequency and release conditions are documented terms, and changing them requires an amendment and the consent of the parties who benefit from the current arrangement.
— It requires operational cooperation beyond the sponsor. The servicer must report at the required frequency, and the trustee or administrator must be able to act on a daily instruction. A sponsor that is ready and a trustee that is not will settle at the trustee’s pace.
— For a pool in amortization the benefit is bounded. Most of the balance in an amortizing pool is genuinely required at the next payment date. The recoverable portion is the excess, sized above at 3 to 9 percent from cadence alone.
What daily settlement requires
The prerequisites are the same four capabilities the companion papers describe, applied to a different purpose.
1. Connected banking and processor data. Collections have to be observed where they land, not where they are reported. A release calculation run against a servicer summary inherits the delay it was meant to eliminate.
2. Daily asset-level reconciliation. The borrowing base is only as current as the asset records behind it. Eligibility, delinquency status and principal component must be accurate on the day the release is calculated.
3. Verified rather than reported collections. Releasing cash against a reported collection that has not been evidenced converts a reporting error into a cash transfer. Verified cash, traced from a third-party obligor to a specific asset and a matching receivable reduction, is the only sound basis for same-day release.
4. Exception governance. Unassigned or unverified cash is not released. It is held with a category, an owner, an age and an expected resolution, and the release calculation is run on the verified population.
Read in reverse, this is a useful diagnostic. A sponsor able to settle daily has demonstrated, by doing it, that its data infrastructure produces accurate asset-level positions every day. That demonstration is worth something independent of the cash it releases.
Conclusion
For most of this market’s history the argument against daily settlement was practical rather than philosophical. Running a borrowing base and a waterfall every day meant daily data from multiple servicers, daily reconciliation at the asset level and daily instruction to a trustee, and the systems to do that had to be built rather than bought. Monthly settlement was a reasonable accommodation to what was possible.
Those conditions have changed. Connectivity to banking and payment processor data is now standard infrastructure, reconciliation at the individual transaction level is a computing problem solved some time ago, and the release calculation itself is arithmetic. Granite Pass has run structured finance data this way since 2013, when doing so meant building the warehouse before running the first reconciliation. The cost of running it today is immaterial against the exposure it covers.
The question worth asking. The question is no longer whether daily settlement can be done on a given transaction. It is why it is not being done. A sponsor paying a million dollars a year, every year, to hold cash that protects no one should be able to say what that payment buys. A lender declining to release cash that its own borrowing base no longer requires should be able to say the same.
There is a diligence version of the same question. Before extending credit to a new originator, a lender can ask whether the platform can produce verified, asset-level collection data daily. The answer is informative whether or not daily settlement is ever adopted, because a platform that can settle daily has proven something about its operational control that a platform that cannot has not.
Final takeaway. Collections arrive daily. Waterfalls run monthly. The gap between those two frequencies is not a credit protection, it is a financing cost, and it is paid every year by someone who receives nothing for it. A daily borrowing base and a daily waterfall close the gap without changing the lender’s position on the payment date, and in a revolving master trust they close it completely. Seeing every dollar daily is what makes that possible, and that is the discipline Granite Pass is built on.
Companion papers. This paper is the economic counterpart to Law of Conservation of Asset Principal, which sets out the framework for tracking asset value as it moves from cash, to principal, to receivable, and back to verified cash, and to Cash Verification: The First Line of Fraud Deterrence, which explains why independently evidenced cash is the strongest early control in structured finance. Readers seeking the operational foundation on which daily settlement depends should reference both.
Disclaimer. This paper is provided for informational purposes only and does not constitute legal, accounting, tax or investment advice. All portfolio figures, assumptions and results are illustrative and are not drawn from any specific transaction. Actual outcomes depend on transaction documents, collection patterns, borrowing base conventions and the operational capability of the parties involved.